More bookings do not always mean more margin: reading occupancy, ADR and RevPAR
Short-term rental in Morocco: understand occupancy rate, ADR and RevPAR, and why a full calendar does not guarantee a better margin.
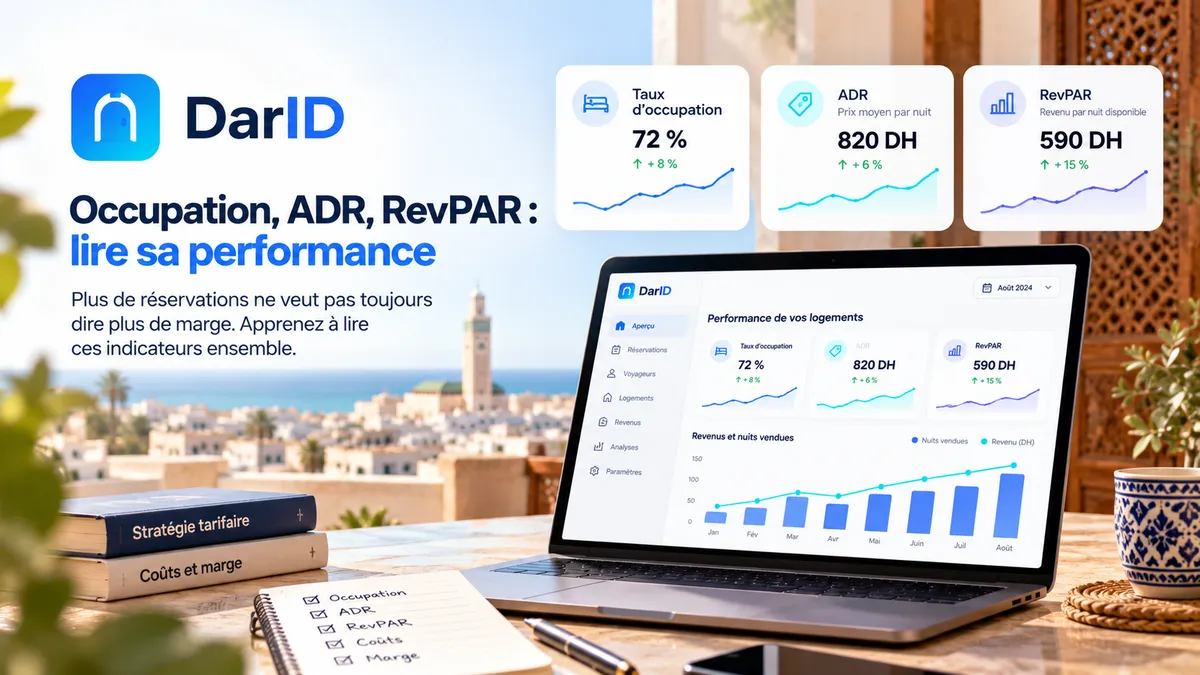
Your calendar is filling up. Yet your revenue per available night may not be rising at the same pace.
To understand what is happening, read several indicators together.
Three indicators, three questions
Occupancy rate: what share of nights was sold?
It shows the share of available nights that were booked. Higher occupancy means more nights sold. On its own, it does not tell you at what price.
ADR: at what average price?
ADR, or average daily rate, shows how much an actually booked night generates on average. Higher occupancy with a lower ADR can produce a very different result from both indicators rising together.
RevPAR: what revenue per available night?
RevPAR measures accommodation revenue per available night. It lets you read occupancy and average price together.
Market example: in its 29 September 2026 update covering August 2026, AirDNA reported for Casablanca 54% occupancy, a $62 ADR and a $34 RevPAR. These figures describe an aggregated market, not the expected performance of a specific property.
Assessing your margin requires more information
None of these three indicators is your margin. You also need to look at commissions, cleaning, energy, maintenance, staff, taxes and other costs actually incurred.
Separate variable and fixed costs
Platform commissions, payment fees, outsourced cleaning or consumables can move with the number of bookings. Other costs do not move the same way. This distinction helps explain why two months with similar revenue can produce different results.
A simple example
Imagine two months. The first shows 70% occupancy at an average price of 900 MAD. The second reaches 82% but the average price drops to 720 MAD. The calendar looks fuller, but this rise in occupancy is not enough to conclude that economic performance improved.
Then add costs: an extra night can generate revenue while contributing less than expected.
This example is an educational simulation, not a Moroccan market average.
Compare comparable periods
Do not compare a high-season weekend with a full low-season month without saying so. Keep the same scope: same property or portfolio, same revenue definition, same reference period and same cost categories.
For a property management business, separate properties with very different pricing positions when needed. An overall average can hide opposite situations.
Read the trend, not just the level
Compare each indicator with previous months. A slight drop in occupancy can be acceptable if average price and RevPAR rise with controlled costs. Conversely, record occupancy with a sharp price drop deserves a closer look before being celebrated.
A minimal monthly dashboard
Track at least: available nights, nights sold, occupancy rate, accommodation revenue, ADR, RevPAR and main variable costs. The goal is not a complex spreadsheet, but being able to explain why revenue or margin changes.
Market data can help place a trend in context. Always check the month, geography, type of accommodation and methodology, and keep your own history as the main reference. For a city-level example, see our occupancy and ADR analysis for Morocco.
Frequently asked questions
Is a high occupancy rate always positive?
It shows strong use of capacity, but on its own it does not tell you whether price or margin are satisfactory.
Are ADR and RevPAR the same thing?
No. ADR relates to nights sold; RevPAR relates accommodation revenue to available capacity.
Can I compare my ADR to a market average?
Yes, as a benchmark, provided you check the city, property type, period and methodology. A market average is not a promise of individual revenue.